


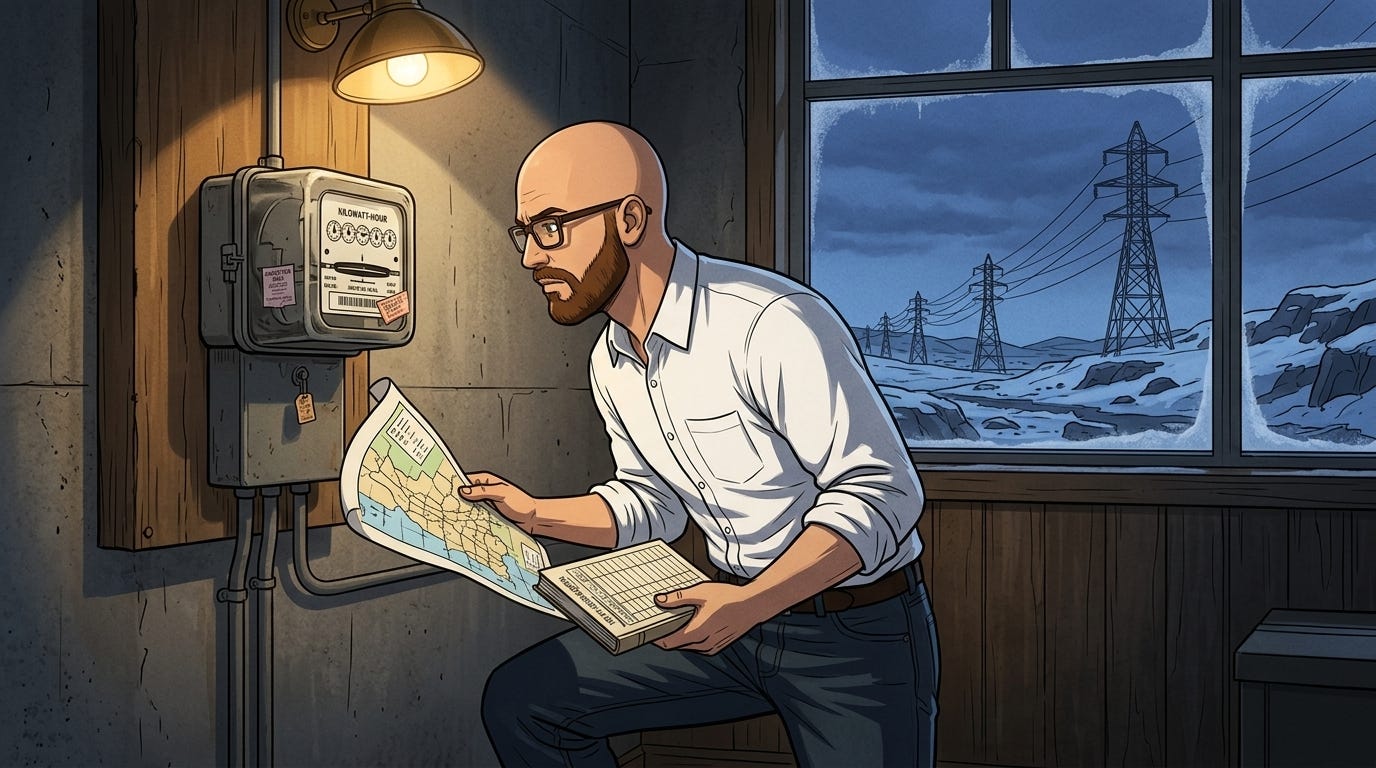
The line is ten percent.
Natural Resources Canada draws it around the house, not the car. Heat. Lights. Appliances. If a household spends a tenth of its income on those, the department’s Energy Fact Book, Spring 2026 Edition calls it energy poverty. In 2023, in-home energy averaged $2,376, three percent of average disposable income. Across the country, 5.6 percent of households crossed the ten percent line. In Newfoundland and Labrador, 13.7 percent did.
The fact book is explicit about the boundary. Energy, in this context, includes what is needed inside the home and excludes transportation.
That is the household finding inside a departmental ledger that opens by calling Canada an energy nation.
The driveway is the larger bill
Canadian households spent $4,943 on energy in 2023. The in-home piece, heating and cooling, lighting, running appliances, was $2,376. Fuels for vehicles and tools averaged $2,567.
The larger number sits outside the poverty definition.
Taken together, energy accounted for 6.4 percent of household spending after income taxes, pension contributions, and other deductions. Lower-income households spend a larger share of their disposable income on energy. The fact book does not give the size of that gap. It records that the gap exists.
Inside the house, the load is heat. Seventy-nine percent of residential energy consumption in 2023 went to space and water heating. Space heating alone was 815 petajoules, 59 percent of home use. Water heating was another 265 petajoules, 19 percent. Appliances, lighting, and cooling made up the rest of a 1,372-petajoule residential total.
Natural gas supplied 52 percent of space heating. Electricity supplied 33 percent. Wood 8 percent. Heating oil 5 percent. Other fuels 2 percent.
Residential energy efficiency improved 38 percent between 2000 and 2023, saving 520 petajoules and $13.4 billion in energy costs. Residential energy use fell 1 percent over that period. Without those efficiency gains, the book says, it would have risen 37 percent.
The poverty line still sits on the page.
Atlantic rates, Montreal prices
Nova Scotia’s energy poverty rate was 12.5 percent. Prince Edward Island’s was 11.4 percent. New Brunswick’s was 10.7 percent. Yukon sat at 11.1 percent. The Northwest Territories at 9.5 percent. Alberta, the province with the largest energy employment in the book, was 7.3 percent.
Quebec was 4.2 percent. Ontario 4.8 percent. British Columbia 4.9 percent. Manitoba matched the national rate at 5.6 percent. Nunavut was the lowest on the chart, at 3.7 percent.
The annex points to two Statistics Canada sources for those affordability pages: an estimation of energy poverty rates using the 2021 Census of Population, and the 2023 household expenditure table behind the dollar figures.
A later page in the same book puts average residential and industrial electricity prices, including taxes, as of April 2025, drawn from Hydro-Québec’s comparison of major North American cities.
Montreal was 9.53 cents a kilowatt hour for a residential customer. Winnipeg 12.07. Vancouver 13.43. Toronto 17.90. St. John’s 17.92. Regina 20.58. Moncton 20.84. Halifax 21.50. Charlottetown 22.64. Edmonton 23.10.
The industrial column is a different map. Winnipeg 5.69 cents. Montreal 6.35. Vancouver 7.06. Edmonton 8.79. Halifax, the highest industrial figure on the chart, 15.45.
The fact book does not join the price chart to the poverty chart. It prints both.
It also prints the 2024 generation mix. Newfoundland and Labrador generated 96.7 percent of its electricity from hydro. Quebec 92.8 percent. Nova Scotia generated 38.9 percent from coal, the highest coal share in the country. Nunavut generated 99.9 percent from petroleum. Nationally, 78 percent of electricity in 2024 came from sources the book labels non-GHG emitting: hydro 55 percent, nuclear 13 percent, other renewables 10 percent.
Newfoundland and Labrador is almost all hydro and sits at the top of the energy-poverty chart. Nunavut is almost all petroleum and sits at the bottom.
The other ledger in the same book
The introduction begins, “Canada is an energy nation.” From hydroelectricity to the oil sands to emerging renewables, it says, the country’s resources have helped build a resilient economy, connect communities, and support energy security at home and abroad.
In 2025, energy accounted for 9.4 percent of nominal GDP, $285 billion. Direct GDP was $244 billion. Indirect another $41 billion. Direct energy jobs numbered 332,800. Indirect jobs 432,000. Total: 764,800.
Energy sector jobs paid an average of $129,498 a year. The average Canadian job paid $62,459.
Energy exports totalled $197.8 billion, 27 percent of Canadian goods exports by value. Eighty-five percent of that energy export value, $168.9 billion, went to the United States. Canada ranked fourth in the world for crude oil production and third for crude oil exports. Eighty-two percent of Canadian crude production went to the United States, which drew 63 percent of its crude imports, and 23 percent of its crude consumption, from Canada.
On the investment pages, capital spending in the energy sector was $89 billion in 2025. Oil and gas extraction took $42 billion of that. Electrical power generation and distribution took $34 billion. Fuel, energy, and pipeline infrastructure made up 31 percent of Canada’s infrastructure net stock. That stock totalled $1,433 billion.
In the Major Projects Inventory, 205 planned energy projects were worth $378 billion, and 113 projects under construction were worth $132 billion. Most major projects were in electricity (221), which the book says now holds the largest share of total project value, $243 billion, surpassing oil and gas.
None of those figures appear on the affordability pages. They sit in the same document.
182 communities, and a faster energy index
A community is energy-reliant, the book says, when it has a higher share of employment from the sector, a relatively high share of total income from that sector, and relatively low sectoral diversity compared with the average Canadian community. There are 182 such communities. Eighty percent are rural or remote.
Alberta has 79 of them. Saskatchewan 44. Newfoundland and Labrador 23. British Columbia 13. Quebec 10. Ontario 6. New Brunswick 4. Manitoba 3.
Newfoundland and Labrador appears on both lists: 23 energy-reliant communities, and the highest energy-poverty rate in the country.
The retail-price pages add a third tempo. The energy component of the consumer price index “has been volatile in recent years and has grown much faster than the non-energy component.” The book attributes that volatility mostly to upstream oil and gas prices and their effect on products such as gasoline. It also states that, compared with other developed economies, Canada’s household energy prices per unit in 2024 were relatively low.
About 81 percent of Canada’s greenhouse gas emissions come from energy. Canadians use more energy, the book says, because of extreme temperatures, a vast landscape, and a dispersed population. Between 2000 and 2023, emissions fell 7 percent while GDP rose 56 percent. Electricity-production emissions fell 61 percent between 2000 and 2024, “largely because of Ontario’s successful coal phaseout action plan, which started in 2001.” Oil and gas production emissions rose 16 percent over that period, against a 67 percent increase in production.
The household arithmetic remains smaller.
$2,376 inside the house. $2,567 in the tank. $4,943 in all. Ten percent of income on the in-home piece is the line the department uses. 5.6 percent of Canadian households were over it. In Newfoundland and Labrador, 13.7 percent were.
The fact book calls that energy poverty. It also calls Canada an energy nation. Both sentences are in the record.
The Energy Fact Book is public, and this archive stays free. Paid membership funds the capacity to work the record, including the household line in a departmental ledger.
Related Hansard Files Articles


Source Documents
Natural Resources Canada. (2026). Energy fact book, Spring 2026 edition (Cat. No. M136-1E-PDF).