

The Twenty-Nine Billion Dollar Lifeline for Families
New government data maps the flow of federal aid, from single parents in rural valleys to the busiest postal codes in the nation.

Every month, a digital pulse travels from Ottawa to bank accounts across the country. It is quiet, automatic, and arguably the most significant economic force in the daily lives of Canadian parents. According to the newly released Canada Child Benefit statistics for the 2024-2025 benefit year, this pulse is now a twenty-nine billion dollar torrent.
The sheer scale of the Canada Child Benefit (CCB) is difficult to visualize. It is not merely a social program. It is a massive, decentralized redistribution of wealth that touches nearly four million families. The latest data provides more than just a ledger of payments. It offers a high-resolution map of domestic life in Canada, revealing exactly who is raising the next generation, where they live, and the financial tightrope they walk.
The Billion Dollar Ledger
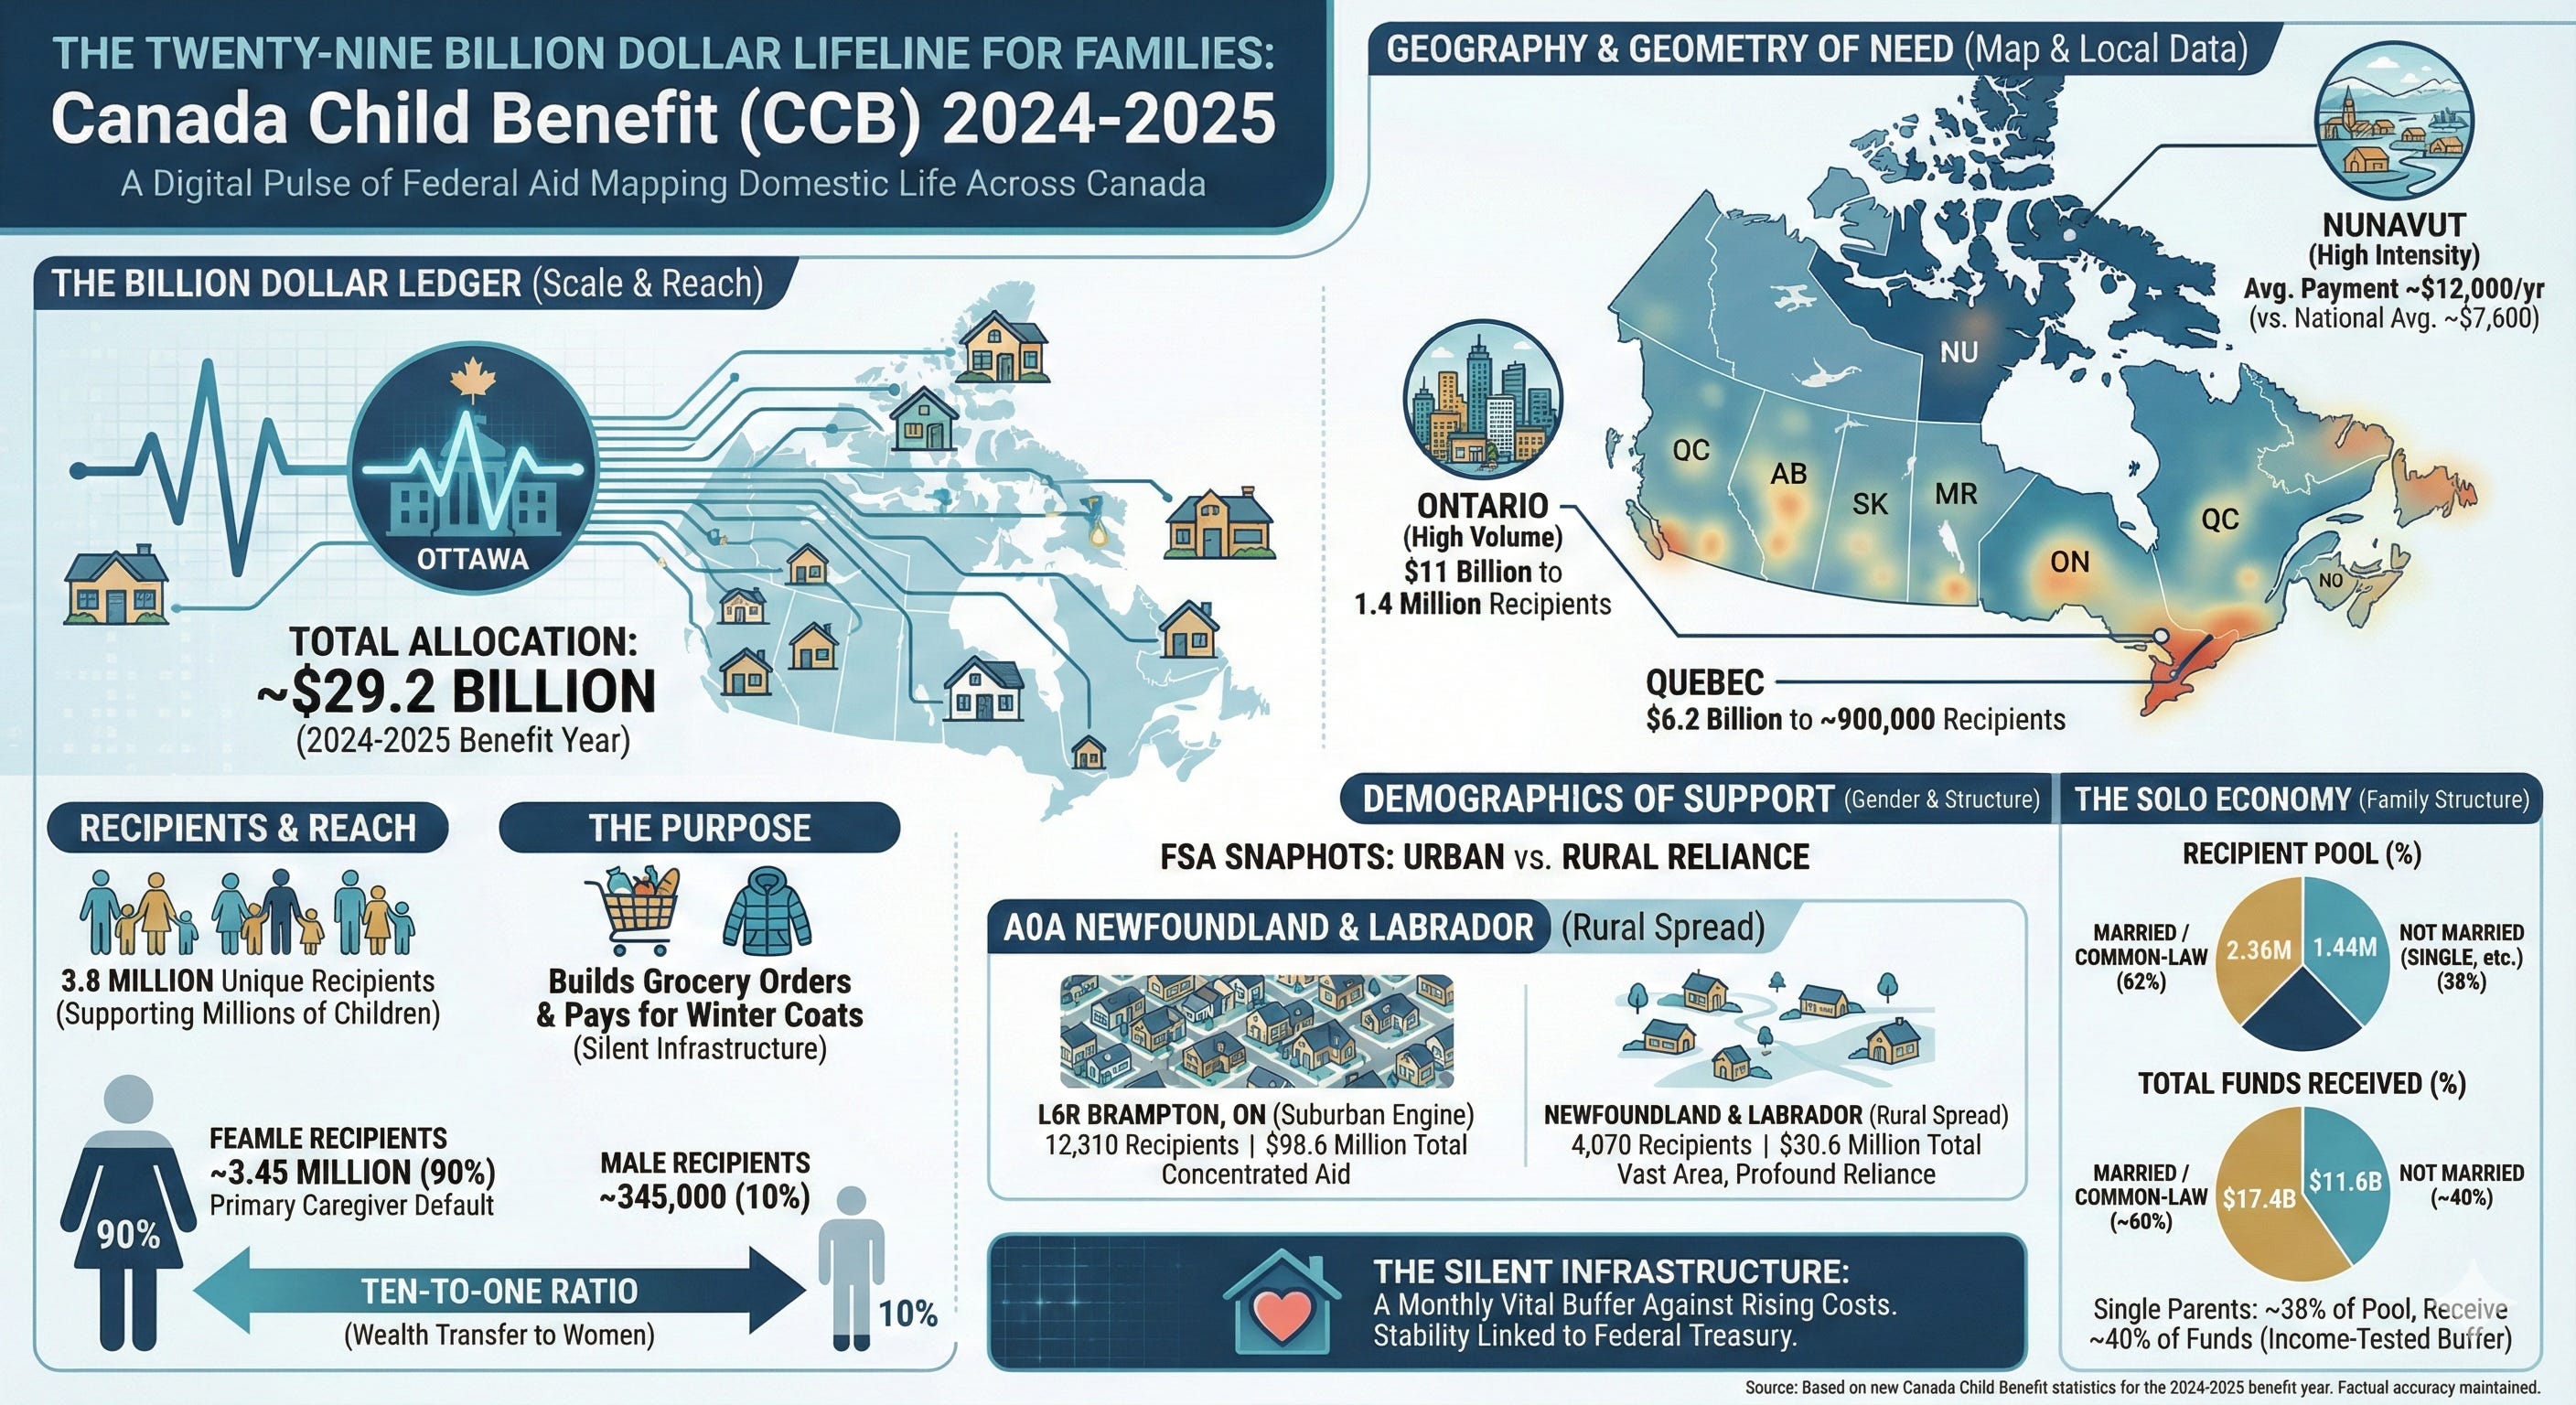
The topline numbers are staggering. For the 2024-2025 benefit year, the federal government has allocated approximately $29.2 billion in payments. This capital flows to 3.8 million unique recipients, supporting millions of children from the Atlantic coast to the Arctic circle.
To put this expenditure in perspective, the amount transferred directly to families roughly equals the entire GDP of some small nations. It is a silent infrastructure project, but instead of building bridges or highways, it builds grocery orders and pays for winter coats.
The geography of this spending is uneven, dictated by population density and economic necessity. Ontario alone accounts for $11 billion of the total payout, distributed among 1.4 million recipients. Quebec follows with $6.2 billion going to nearly 900,000 recipients. However, the raw totals hide the intensity of the need. To understand the true impact, one must look at the edges of the map.
In Nunavut, a mere 5,780 recipients receive over $69 million. While this seems small in the aggregate, the average payment per recipient in Nunavut is approximately $12,000 annually, significantly higher than the national average of roughly $7,600. This disparity underscores the program’s design. It scales up to meet lower incomes and larger family sizes, acting as a critical buffer in regions where the cost of living is exorbitantly high.
The Geometry of Need
The data breaks down the country not just by province, but by “Forward Sortation Area” (FSA), the first three characters of a postal code. This granular view reveals the specific neighbourhoods where federal support is most concentrated.
Consider the postal code L6R in Brampton, Ontario. This single area represents 12,310 recipients who collect a combined $98.6 million. It is a bustling suburban engine of families, drawing in nearly one hundred million dollars of federal support into a few square kilometers.
Contrast this with a rural code like A0A in Newfoundland and Labrador. Here, 4,070 recipients are spread over a vast geographic area, yet they draw in $30.6 million. The density is different, but the reliance is just as profound.
The statistics also highlight the quiet crisis of the “middle.” While the lowest income brackets receive the highest individual cheques, the volume of recipients in the middle-income tiers is substantial. Families earning between $40,000 and $50,000 are numerous, with hundreds of thousands of households relying on these payments to bridge the gap between their wages and the rising cost of living.
A Mother’s Stipend
Perhaps the most striking revelation in the data is the gender divide. The Canada Child Benefit is, in practice, a transfer of wealth to women. The legislation presumes the female parent is the primary caregiver unless stated otherwise, and the statistics reflect this administrative default with overwhelming clarity.
Of the 3.8 million recipients, approximately 3.45 million are female. Only 345,000 recipients are male. This is a ten-to-one ratio.
This gender imbalance tells a story about labour and responsibility. Despite shifting cultural norms regarding fatherhood and shared parenting, the administrative burden and the financial management of child-rearing expenses remain firmly in the hands of women. When the government writes a cheque for the welfare of a child, nine times out of ten, it is a mother who cashes it.
The data further classifies a small but visible number of gender-diverse recipients, acknowledging the changing landscape of identity documentation, though the numbers remain statistically small compared to the binary categories.
The Solo Economy
The financial pressure on single parents is a well-documented reality, and the CCB data offers a stark look at this demographic. The tables distinguish between “Married” and “Not Married” recipients.
Married recipients (including common-law) make up the majority, with 2.36 million people receiving $17.4 billion. However, the “Not Married” category—comprising single, separated, divorced, and widowed parents—includes 1.44 million recipients claiming $11.6 billion.
The math here is revealing. Single parents represent about 38 percent of the recipient pool, yet they receive nearly 40 percent of the total funds. The average annual payment for a single parent is slightly higher than that of a married recipient. This reflects the income-testing mechanism of the benefit. Single-income households naturally fall into lower net income brackets, triggering higher benefit calculations to compensate for the lack of a second earner.
The Silent Infrastructure
The 2024-2025 statistics paint a portrait of a nation where child-rearing is a heavily subsidized activity. The $29 billion figure is not static. It moves through the economy, vanishing into grocery stores, daycares, and landlords’ pockets within days of issuance.
This data demonstrates that the state has become a silent third partner in the raising of Canadian children. Whether in the high-density subdivisions of the Greater Toronto Area or the remote communities of the North, the dependency on this monthly transfer is uniform. It is a lifeline that, if cut, would result in an immediate and catastrophic shock to millions of households.
As the benefit year progresses, these numbers will fluctuate slightly with changes in marital status and income adjustments. Yet the core truth remains constant. The financial stability of the Canadian family is now inextricably linked to the federal treasury, to the tune of billions of dollars a year.
Source Documents
Canada Revenue Agency. (n.d.). Canada Child Benefit Statistics - 2024-2025 Benefit Year - Canada.ca.pdf.
Canada Revenue Agency. (n.d.). ccb1-en.pdf.
Canada Revenue Agency. (n.d.). ccb2-en.pdf.
Canada Revenue Agency. (n.d.). ccb3-en.pdf.
Canada Revenue Agency. (n.d.). ccb4-en.pdf.
Canada Revenue Agency. (n.d.). ccb5-en.pdf.