

Eleven Million Canadians Relying on Small Tax Rebate Checks
A comprehensive look at the billions of dollars distributed to low income families through the national goods and services tax credit system.

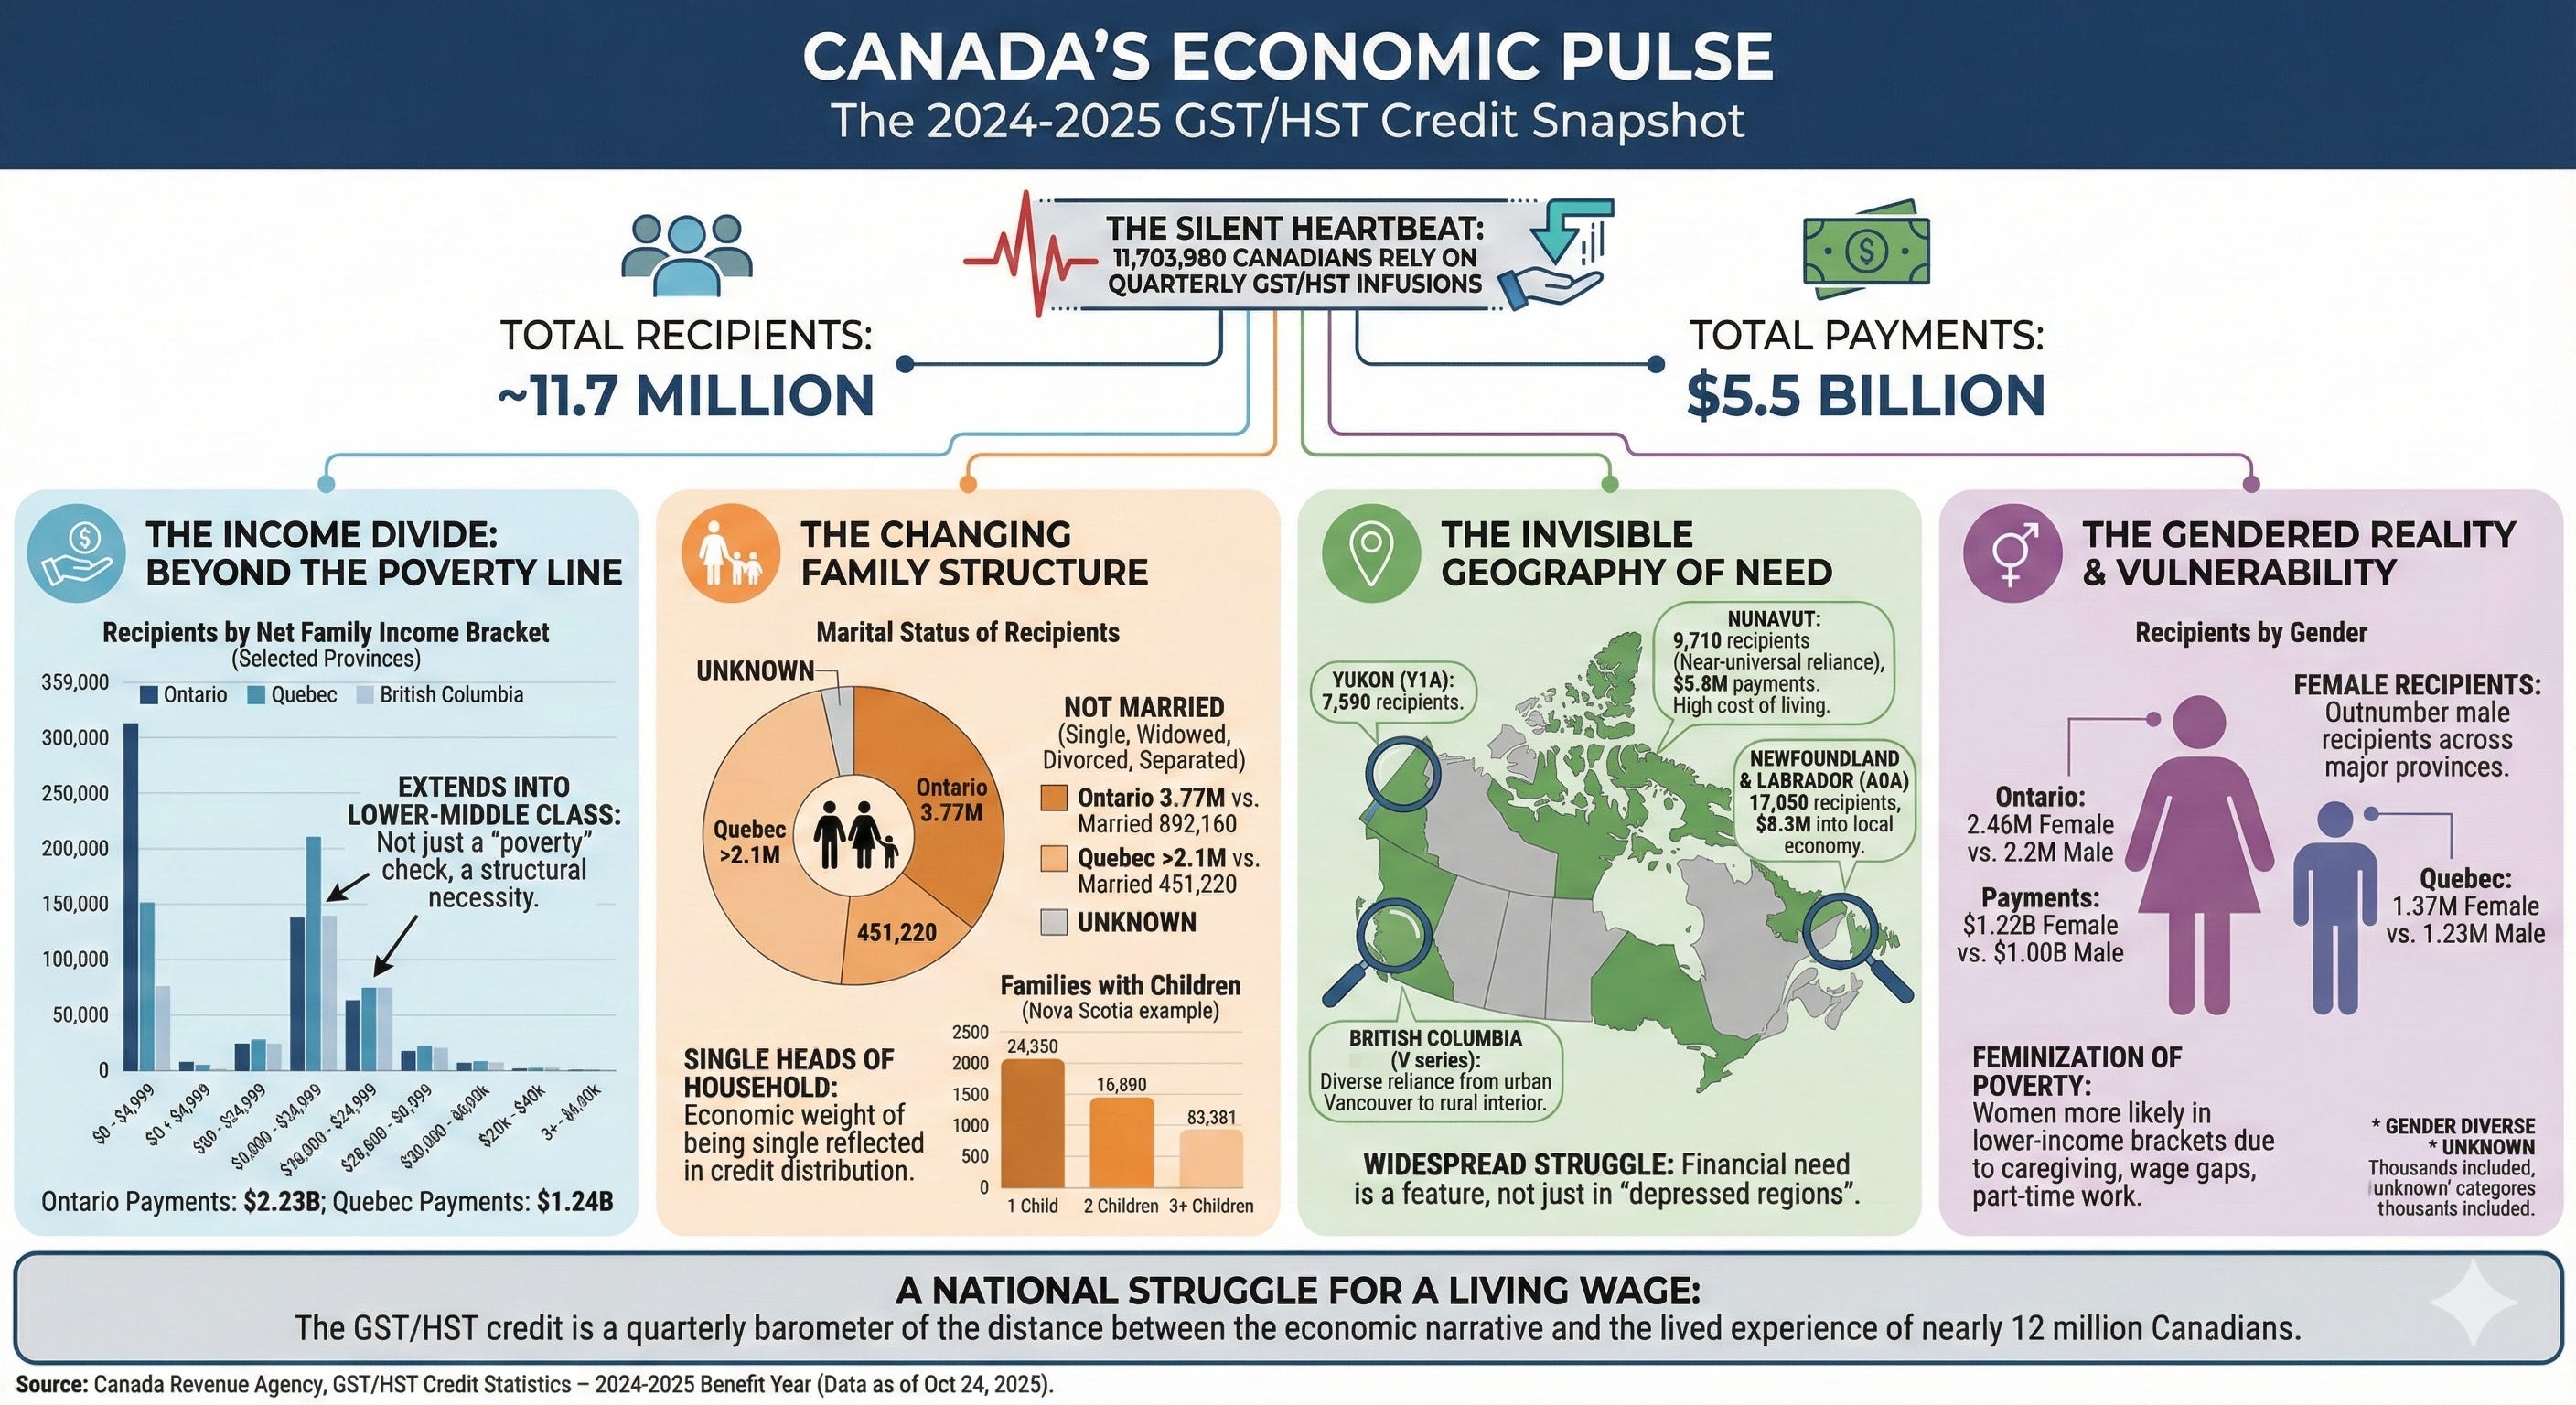
The silent heartbeat of the Canadian economy often pulses through an automated bank deposit rather than a boardroom negotiation. In the final weeks of 2025, the release of the latest statistics regarding the Goods and services tax credit revealed a nation leaning heavily on its social safety net. Across the provinces and territories, 11,703,980 individuals waited for the quarterly infusions of cash that have become a non-negotiable part of their household budgets. This is the story of nearly twelve million people, a vast cross-section of the population whose financial survival is indexed to a tax system designed to offset the very costs of living in a modern developed nation.
The data, processed as of late October 2025, provides a frozen moment in time for the 2024 to 2025 benefit year. It is a ledger of the vulnerable, the working poor, and the middle class families whose net income falls below the threshold of self-sufficiency. Behind the staggering 5.5 billion dollars in total payments lies a narrative of regional disparity, changing family structures, and a persistent gender gap in economic security. From the rugged coasts of Newfoundland and Labrador to the high-density corridors of Ontario, the reliance on these credits paints a portrait of a country where the cost of daily essentials often outpaces the capacity of the individual to pay for them.
The Five Billion Dollar Income Divide
When the numbers are stripped of their bureaucratic framing, the reality of the Canadian income distribution becomes starkly visible. The largest concentration of recipients exists in the lowest possible income brackets, highlighting a segment of the population that survives on what many would consider impossible margins. In Ontario alone, over 359,000 recipients reported a net family income of less than 5,000 dollars. These are the individuals at the absolute edge of the economy, yet they are part of a massive cohort. Across the country, the trend repeats. Quebec sees nearly 234,000 individuals in this same extreme low-income bracket, while British Columbia accounts for more than 153,000.
As income scales upward, the number of recipients does not immediately drop off, indicating that the need for the credit extends well into the lower-middle class. The bracket for those earning between 20,000 and 24,999 dollars represents a peak in many provinces. In this range, Newfoundland and Labrador has 28,400 recipients, and Alberta has 98,780. The persistence of these numbers through the 30,000 and 40,000 dollar income ranges suggests that the Goods and services tax credit is not merely a “poverty” check, but a structural necessity for a significant portion of the workforce. It is a quarterly acknowledgement that even for those with a steady, albeit modest, income, the basic cost of the goods and services required to function in society remains a burden that the state must partially alleviate.
The total dollar amounts distributed in these brackets are transformative for the local economies they enter. In Ontario, the grand total of payments reached 2.23 billion dollars. In Quebec, it was 1.24 billion. These are not just line items in a federal budget; they are the funds that pay for winter boots in the Maritimes, groceries in the Prairies, and transit passes in the urban centers. The sheer volume of recipients in the sub-30,000 dollar categories confirms that for millions of Canadians, the margin for error in their monthly budget is almost non-existent.
The Changing Face of the Canadian Family
For decades, the image of the Canadian family was built around the nuclear unit, but the 2024 to 2025 statistics suggest a different reality is taking hold. When looking at the marital status of those receiving the credit, the data reveals a country of individuals navigating the economy alone or as single heads of households. Out of the 11.7 million recipients, a vast majority are classified as “not married,” a category that includes single, widowed, divorced, and separated individuals. In Ontario, 3.77 million recipients fall into this category, compared to only 892,160 who are married. This ratio is consistent across the nation.
The economic weight of being single or a single parent is clearly reflected in the credit distribution. In Quebec, over 2.1 million recipients are not married, while only 451,220 are. This demographic reality creates a specific type of vulnerability. Without a second income to buffer against inflation or job loss, the quarterly credit becomes a primary defense mechanism. The data also tracks those whose marital status is “unknown,” a small but persistent group that numbers over 16,000 nationally, representing those whose lives fall through the cracks of standard tax classifications.
The presence of children adds another layer of complexity to these financial lives. While many recipients have no dependent children, a significant number of families are raising the next generation on the back of these credits. In Nova Scotia, over 20,500 families with one child and 14,030 families with two children rely on this support. As the number of children increases, the dollar amount of the credit rises to match the increased cost of dependents, but the number of families in these categories decreases. There are over 8,140 families in Nova Scotia and nearly 125,000 in Ontario with three or more children who are receiving the maximum levels of support. These figures represent the sharp end of the social safety net, where the government is effectively co-financing the upbringing of children in households where the private income is insufficient.
The Invisible Geography of Financial Need
Beyond the provincial totals, the data drills down into the Forward Sortation Areas, the first three characters of a postal code, revealing the specific neighborhoods and rural stretches where the need is most acute. This geographic mapping shows that financial struggle is not confined to “inner cities” or “depressed regions” but is a feature of almost every corner of the country. In Newfoundland and Labrador, the A0A area alone accounts for 17,050 recipients, drawing 8.3 million dollars into the local economy. In the northern reaches of the Yukon, the Y1A area sees 7,590 recipients, a significant portion of the territory’s population.
This geographic data exposes the hidden pockets of poverty in otherwise affluent provinces. In British Columbia, the V series of postal codes shows a diverse range of reliance. From the urban density of Vancouver to the remote communities of the interior, the credit is a constant presence. The Forward Sortation Area data allows for a granular view of where the money goes. It shows that in some rural areas, a huge percentage of the adult population is likely receiving the credit, making the federal government a silent but primary partner in the viability of those communities.
In the territories, the stakes are even higher. Nunavut, with its incredibly high cost of living, shows 9,710 recipients across its few postal codes. Given the small population of the territory, this represents a near-universal reliance on the credit system. The 5.8 million dollars sent to Nunavut through this program is a vital lifeline for a region where food and fuel costs are several times the national average. Similarly, the Northwest Territories see 11,810 recipients, with a total payment of 6.2 million dollars. These are areas where the market fails to provide affordable essentials, and the tax credit acts as a necessary corrective.
The Gendered Reality of Economic Vulnerability
Perhaps the most telling aspect of the 2024 to 2025 statistics is the breakdown of recipients by gender. For decades, economists have spoken of the “feminization of poverty,” and the data from the Canada Revenue Agency provides contemporary evidence of this trend. In every major province, female recipients outnumber male recipients, often by a significant margin. In Ontario, there are 2.46 million female recipients compared to 2.2 million male recipients. In Quebec, the split is 1.37 million females to 1.23 million males.
This gender gap in the credit data suggests that women are still more likely to find themselves in the lower-income brackets that qualify for the credit. This is often tied to roles as primary caregivers, higher representation in part-time or service-sector work, and the persistent wage gap. The total payments reflect this disparity as well. In Ontario, female recipients received 1.22 billion dollars, while male recipients received 1.00 billion. The credit is, in many ways, a subsidy for the economic disadvantages that still disproportionately affect women in the Canadian workforce.
The data also includes a category for “gender diverse” and “unknown” recipients, offering a glimpse into a more modern understanding of identity, though the numbers remain relatively small. There are 1,720 gender diverse recipients in Ontario and 540 in Quebec. While these numbers are a fraction of the total, their inclusion marks a shift in how the government tracks the demographic impact of its social programs. The “unknown” category, often representing those who have not specified a gender on their tax returns or whose data is otherwise incomplete, includes thousands of individuals who are nonetheless part of the 11.7 million person mosaic.
The National Struggle for a Living Wage
As the 2024 to 2025 benefit year draws to a close, the statistics serve as a sobering reminder of the distance between the national economic narrative and the lived experience of the population. While GDP growth and unemployment rates are the standard measures of success, the fact that nearly 12 million people require a tax credit to offset the cost of basic goods is a counter-narrative of struggle. The Goods and services tax credit is a barometer of the national struggle for a living wage.
The reliance on this system is now so deeply entrenched that any change to the eligibility or the amount would have immediate and catastrophic effects on millions of households. It has become a permanent feature of the Canadian financial landscape, a quarterly ritual of redistribution that keeps the bottom from falling out of the consumer economy. The data shows a country where marital status is shifting, where families are smaller but more financially strained, and where the geography of need covers every latitude.
In the end, the 11,703,980 recipients are more than just a statistic. They are the millions of individuals who, despite the challenges of the modern economy, continue to navigate their lives with the help of a small, predictable check from the government. The 5.5 billion dollars distributed is a massive investment in social stability, a quiet acknowledgment that in a country as vast and expensive as Canada, the market alone is not enough to ensure that everyone can afford the basics of a dignified life.
Source Documents
Canada Revenue Agency. (2025, October 24). GST/HST Credit Statistics – 2024-2025 Benefit Year.
Canada Revenue Agency. (2025, October 24). Table 1: GST/HST Credit Recipients and Payments by Province or Territory and Net Family Income.
Canada Revenue Agency. (2025, October 24). Table 2: GST/HST Credit Recipients and Payments by Province or Territory and Marital Status.
Canada Revenue Agency. (2025, October 24). Table 3: GST/HST Credit Recipients and Payments by Province or Territory and Number of Dependent Children.
Canada Revenue Agency. (2025, October 24). Table 4: GST/HST Credit Recipients and Payments by Province or Territory and Gender.
Canada Revenue Agency. (2025, October 24). Table 5: GST/HST Credit Recipients and Payments by Forward Sortation Area (FSA).