

Canada’s Coasts: The Official Projections
A 2021 federal report maps out how sea-level change will reshape Canada’s coastlines by 2100. Here’s a deep dive into what the data shows.

In 2021, the Geological Survey of Canada, a branch of Natural Resources Canada, released a technical report titled “Relative sea-level projections for Canada.” Unlike broad global forecasts, this document provides specific, gridded projections for every part of Canada’s marine coastline. It combines global climate models from the Intergovernmental Panel on Climate Change (IPCC) with a new, highly detailed model of how Canada’s landmass is moving. The result is a granular forecast of what communities can expect by the end of the century. What does this official data actually tell us about the future of our coastlines?
What Is ‘Relative’ Sea-Level Change?
To understand the report’s findings, you first need to grasp the difference between global and relative sea-level change. Global sea-level change is the average rise in the world’s oceans, driven by melting ice sheets and the thermal expansion of warming water. It’s a useful big-picture metric.
Relative sea-level change, however, is what communities actually experience. It measures the sea level in relation to the solid land at a specific location. If the land is sinking, the relative sea-level rise will be greater than the global average. If the land is rising, it can offset global sea-level rise, leading to a smaller increase or even a drop in local sea level. For coastal infrastructure, habitats, and planning, relative sea level is the only number that matters.
Canada’s Moving Landscape: A Legacy of the Ice Age
Why is the land itself moving? The primary driver across Canada is a process called glacial isostatic adjustment (GIA). During the last ice age, the immense weight of the ice sheets pushed the land down. As the ice melted, the land began to rebound, a process that continues today because of the slow, viscous flow of the Earth’s mantle.
This creates a complex picture of vertical land motion across the country.
Rising Land: The Hudson Bay region, which was near the centre of the ancient ice sheet, is rising rapidly. Much of the Canadian Arctic Archipelago is also uplifting.
Sinking Land: In contrast, areas on the periphery of the former ice sheet, like much of the Maritimes and the Beaufort coastline, are sinking.
This vertical land motion is the critical local factor that either exaggerates or counteracts global sea-level rise across Canada.
Three Futures: Understanding the Scenarios
The report projects sea-level changes based on three internationally recognized Representative Concentration Pathways (RCPs) from the IPCC’s Fifth Assessment Report. These scenarios represent different futures based on the concentration of greenhouse gases in the atmosphere.
RCP2.6 (Low Emissions): This is an optimistic scenario that assumes strong, immediate global action to mitigate climate change. By 2100, it projects a median global sea-level rise of 44 cm.
RCP4.5 (Medium Emissions): This scenario represents a future with moderate mitigation efforts. It projects a median global sea-level rise of 53 cm by 2100.
RCP8.5 (High Emissions): This is a high-emissions, business-as-usual pathway. It projects a median global sea-level rise of 74 cm by 2100.
For planners concerned with low-risk tolerance, the report also includes an “enhanced scenario.” This takes the high-emissions RCP8.5 median and adds an extra 65 cm to account for the potential rapid melting of the West Antarctic Ice Sheet, resulting in a total global rise of 1.39 metres.
A Tale of Two Coasts: Where Sea Levels Will Rise and Fall
When the RCP scenarios are combined with Canada’s vertical land motion, a starkly divided picture emerges for the year 2100.
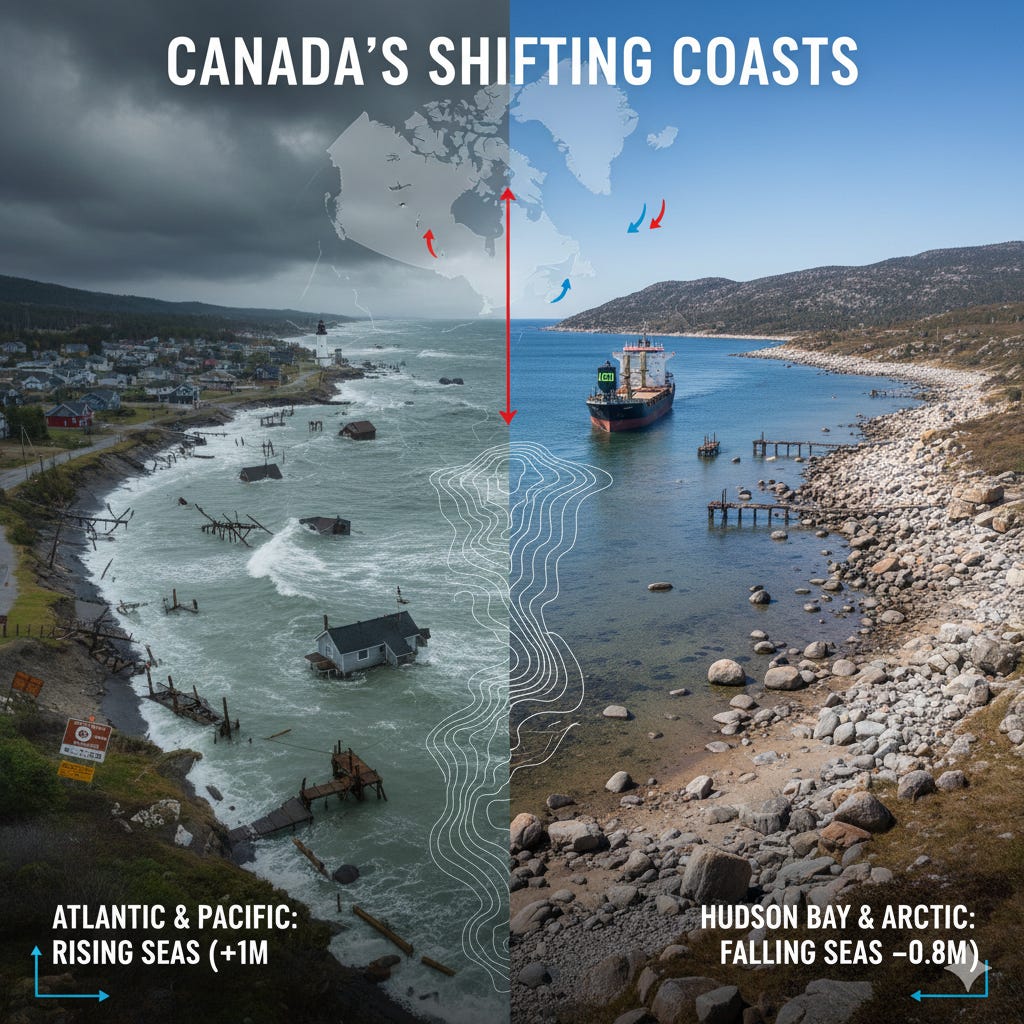
For much of Canada’s east and west coasts, relative sea level is projected to rise significantly, increasing risks of coastal flooding and erosion. Under the high-emissions RCP8.5 scenario, parts of the Maritimes and the Beaufort Sea coastline could see a relative sea-level rise of 100 cm (1 metre) or more.
However, in the Hudson Bay region and large parts of the Arctic, the story is completely different. The land is rising so fast that it will outpace even high-end projections of global sea-level rise. This means relative sea level is projected to fall, in some areas by more than 80 cm. While this avoids flooding, it creates its own set of challenges, including new navigation hazards for shipping due to reduced water depths and impacts on coastal infrastructure like ports and docks.
The report offers clear guidance for planners. For many purposes, it suggests using the 95th percentile of the high-emission RCP8.5 scenario as the appropriate planning level, especially where tolerance for risk is low. It also warns that its projections may underestimate sea-level rise in areas with thick unconsolidated sediments, like the Fraser and Mackenzie river deltas, where local ground subsidence from sediment compaction adds to the problem.
The Data Brief
It’s Relative: What matters for Canadian communities is relative sea-level change, which combines global sea-level rise with local vertical land motion.
A Rebounding Nation: Canada’s landscape is still recovering from the last ice age. The Hudson Bay area is rising, while the Atlantic coast is sinking, dramatically altering local sea-level projections.
Three Possible Futures: Projections to 2100 depend heavily on global emissions, ranging from a median global rise of 44 cm (low emissions) to 74 cm (high emissions). An “enhanced” scenario considers a rise of 1.39 metres.
A Divided Outlook: Most of Canada’s Atlantic, Pacific, and Beaufort coasts face rising seas and increased flood risk. In contrast, Hudson Bay and the Arctic face falling sea levels, creating navigation hazards.
Guidance for Decision-Makers: The report advises planning for high-end scenarios where risk tolerance is low and warns its models do not include local subsidence on major river deltas.
Planning for Certainty and Uncertainty
This report does more than just present data; it provides a framework for decision-making in the absence of perfect certainty. By mapping out different scenarios, it allows planners to assess risks and compare the long-term costs of mitigation and adaptation. The projections are not predictions of an unchangeable fate. Instead, they are a sober, evidence-based tool for confronting the specific, localized challenges that climate change will bring to Canada’s shores.
Source Documents
James, T.S., Robin, C., Henton, J.A., and Craymer, M. (2021). Relative sea-level projections for Canada based on the IPCC Fifth Assessment Report and the NAD83v70VG national crustal velocity model. Geological Survey of Canada, Open File 8764.